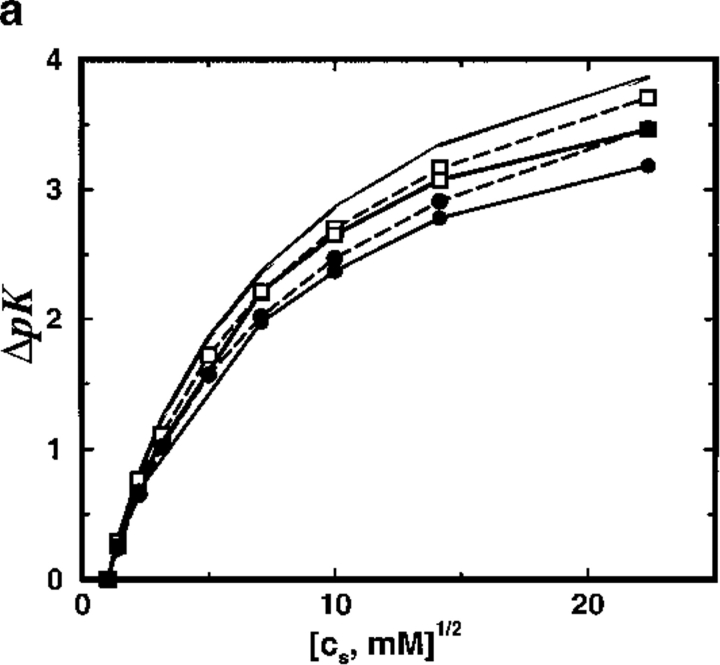
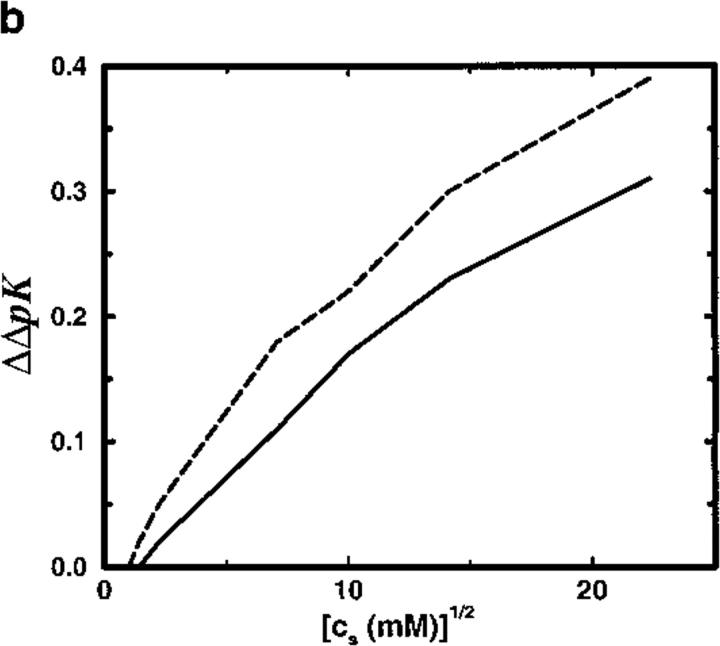
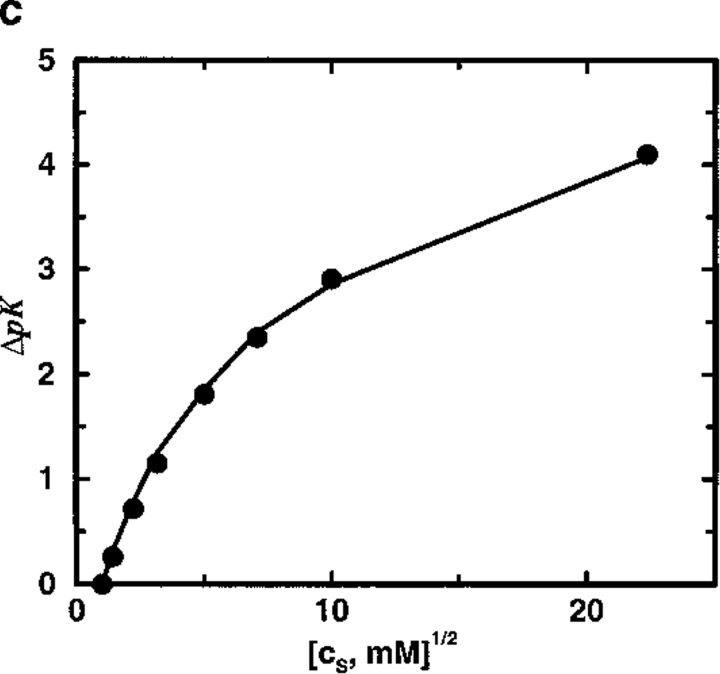
Fig. 4.
(a) Total shift in ion binding constant ΔpK, owing to solution ionic strength, is plotted as a function of salt concentration cs for the SC8 model. A reference state at cs = 1 mM is chosen and the protein is allowed to bind two divalent cations. Results from MC simulations and TK calculations are compared as solid and broken lines, respectively. Lines marked by solid circles correspond to a dielectric boundary radius Rd = 18Å and those marked by open squares denote Rd = 12Å; unmarked lines refer to a homogeneous dielectric response (Rd = 0Å). (b) The shift of ΔpK arising from the presence of an interior vacuum ΔΔpK = ΔpK (Rd = 0Å) − ΔpK (Rd = 14Å) is demonstrated as a function of salt concentration cs. In the solvent region, the relative dielectric permittivity is ɛs = 78.7. Solid line shows MC data and broken line indicates TK results. (c) Total shift in ion binding constant ΔpK, owing to solution ionic strength, is plotted as a function of salt concentration cs for a spherical protein model with eight randomly placed negative charges. Results from MC simulations and TK calculations are compared as solid line and solid circles, respectively. The protein dielectric boundary radius was Rd = 12Å in all calculations.


