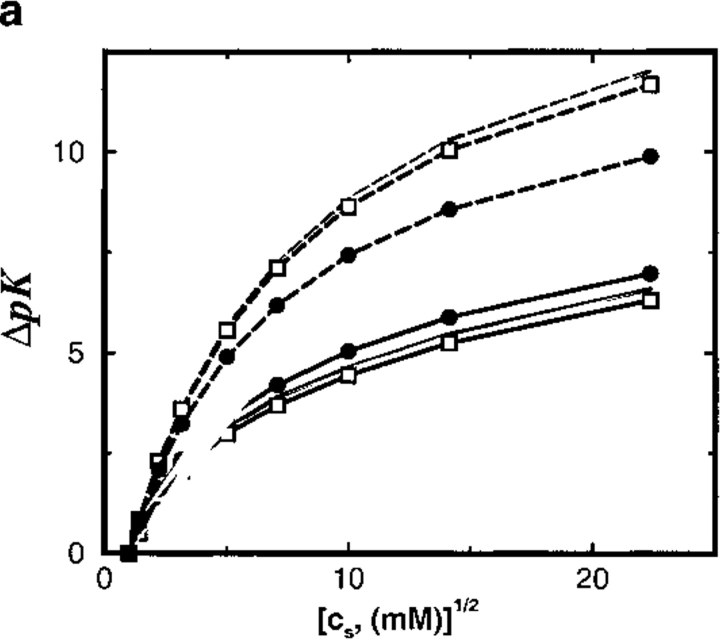
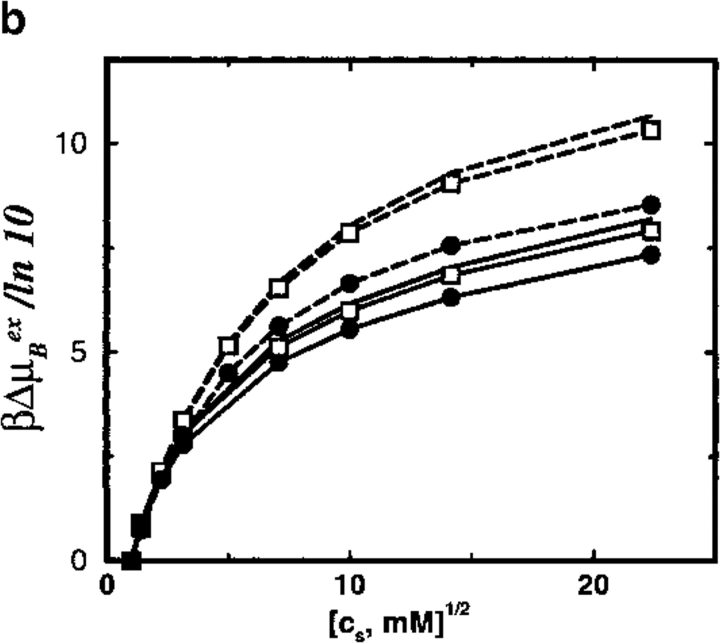
Fig. 5.
(a) Total shift in ion binding constant ΔpK, owing to solution ionic strength, is plotted as a function of salt concentration cs for the SC24 model. Other details are as for Fig. 4A ▶. (b) The difference of excess chemical potentials βΔμBex = βμBex(cs) − βμBex(cs = 1 mM) for a divalent cation in a bulk monovalent electrolyte solution is plotted as a function of salt concentration cs.


