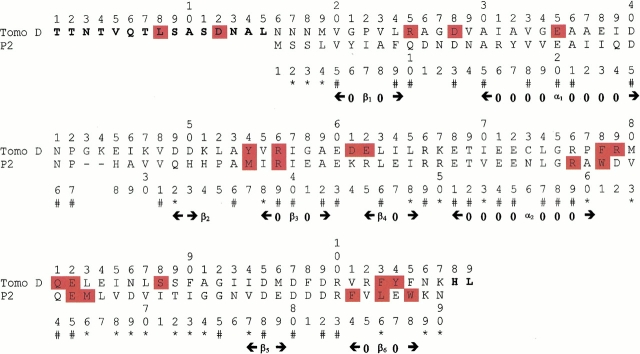
Fig. 1.
Alignment of the P2 protein and Tomo D used to generate models. (#) Identical residues; (*) conservative substitutions. The sites of proteolytic cleavages (see Results section) are highlighted in red. Residues of Tomo D not aligned with the P2 sequence are shown in bold. The secondary structure of the P2 protein, determined by means of the DSSP program (Kabsch and Sander 1983), is also shown.

