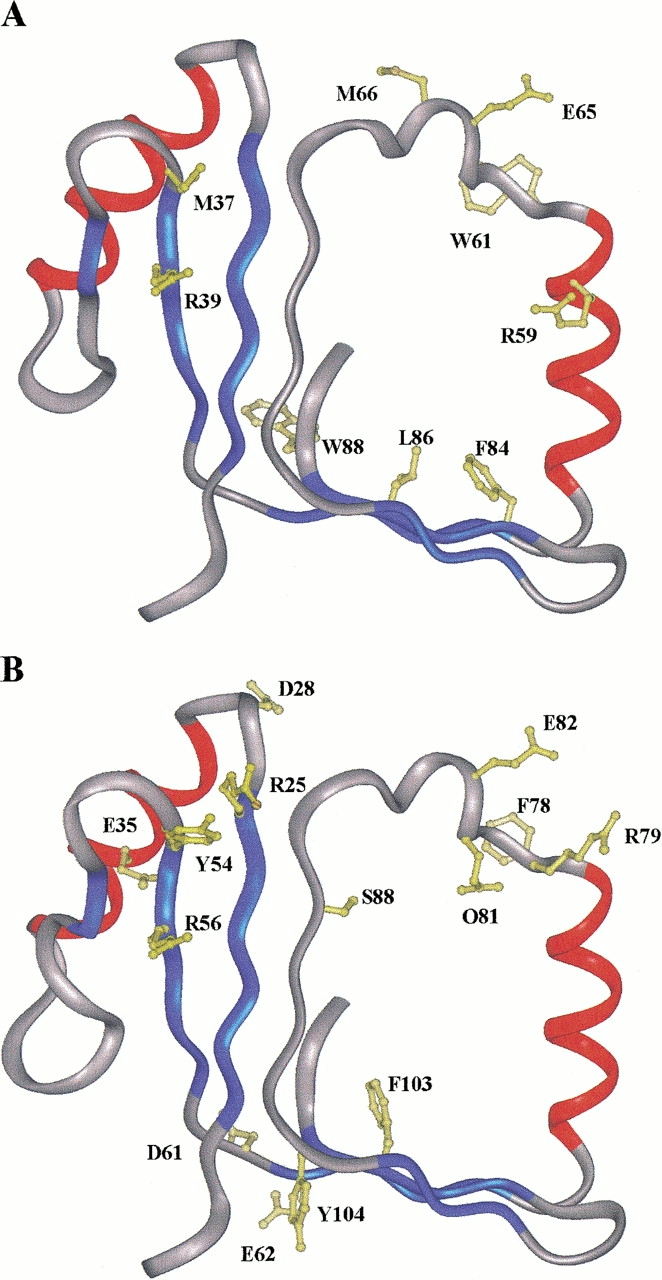
Fig. 3.

Structure 3 of the P2 template (A) and one of the modeled structures (model 3) of Tomo D (B) are shown, respectively, with the residue side chains at the limited proteolysis sites. Color codes in (C) and (D) correspond to secondary structure: α-helix (red), β-strands (blue), loops (white). The same color code for P2 structure in (A) has been used for the corresponding model in (B).
