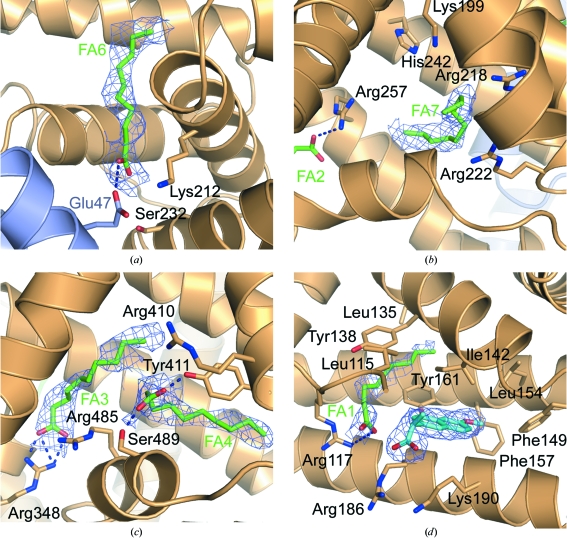
Figure 2.
Ligand binding in the HSA–GA–naproxen complex. The HSA chain is shown in light orange and the GA module is shown in light blue. Electron density for fatty acids is shown as 2m|F o| − D|F c| OMIT maps contoured at 0.21 e Å−3. (a) The fatty acid in FA6 near the GA-binding site. (b) The fatty acid in drug site 1 (FA7). The orientation of the fatty acid carboxylate moiety is not clear and has not been modelled. (c) The fatty acids in drug site 2 (FA3, FA4). (d) Naproxen binding in the haemin site. Naproxen is shown as cyan sticks, with a 2m|F o| − D|F c| electron-density map contoured at 0.21 e Å−3 (1.0σ) covering the molecule. Residues 104–113 have been removed for clarity.

