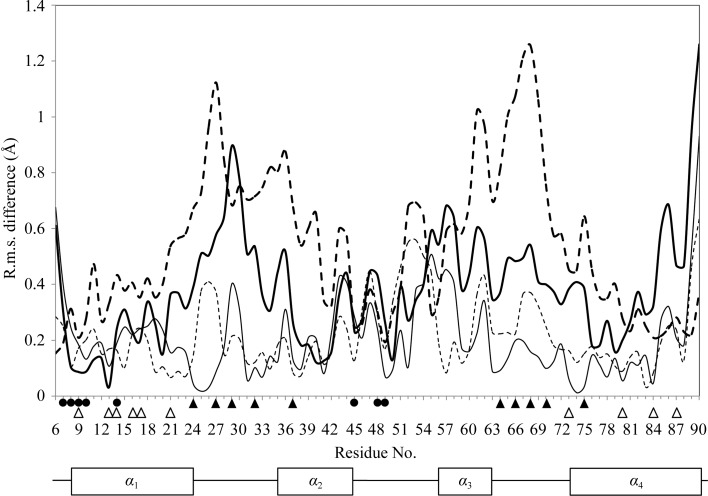
Figure 2.
Atomic (Cα) r.m.s. difference of each residue between CAL7.5 and CAL6.0. The r.m.s. differences between the A chains are shown as thin lines and those between the B chains are shown as thin dashed lines when the corresponding chains are superposed. The r.m.s. differences between the A chains are shown as thick lines and those between the B chains are shown as thick dashed lines when the other chains are superposed. Residues that participate in interchain hydrogen bonds and hydrophobic interactions are indicated by spheres and white triangles, respectively. Ca2+-binding residues are indicated by black triangles. Secondary-structure elements are shown below the graph.

