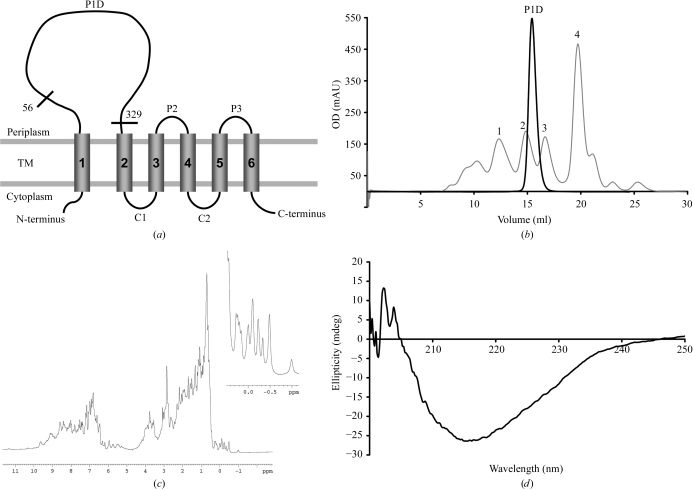
Figure 1.
Characterization of P1D. (a) Schematic representation of the E. coli YidC topology, according to Sääf et al. (1998 ▶). The transmembrane segments (TM), the cytoplasmic (C1 and C2) and periplasmic (P2, P3) loops and the borders of P1D are indicated. (b) Typical size-exclusion chromatography profile (A 280) of P1D on a Superdex 200 HR 10/30 column. The elution positions of the calibration markers (grey line) are indicated (1, γ-globulin; 2, ovalbumin; 3, myoglobin; 4, vitamin B12). (c) One-dimensional 1H NMR spectrum of P1D. Details of the signals upfield of 0.5 p.p.m. are given in the inset. (d) Far-UV CD spectrum of P1D.

