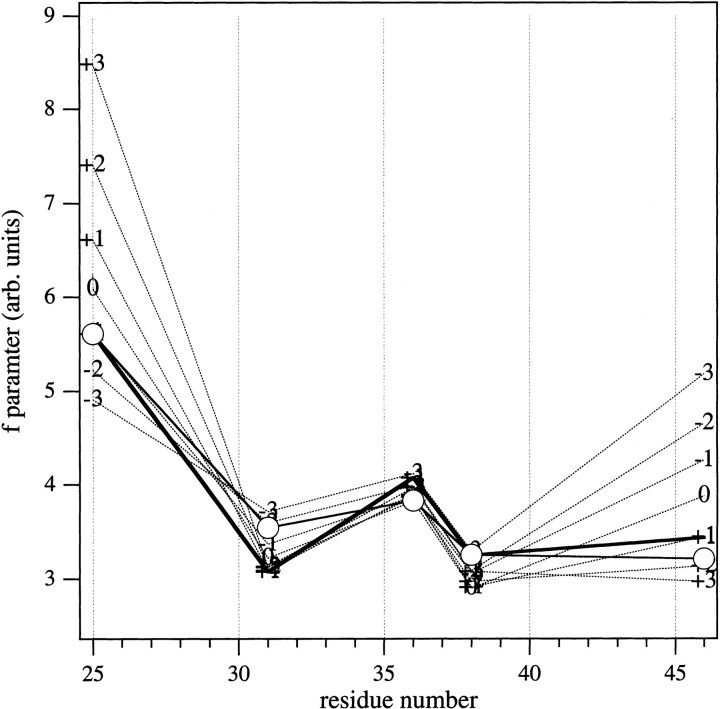
Fig. 8.
Sequence profiles of the f-parameter from cysteine–maleimide mutants of the M13 major coat protein at different vertical shifts (broken lines), for the structure shown in Fig. 6 ▶ that was optimized with zero shift. The heavy solid line gives the sequence profile for the final structure that is reoptimized with +1 Å vertical shift. Circles are the experimental outer hyperfine splitting profile that is scaled linearly (with offset) for best match to the f-parameter profile of the final (+1 Å-shifted) structure.

