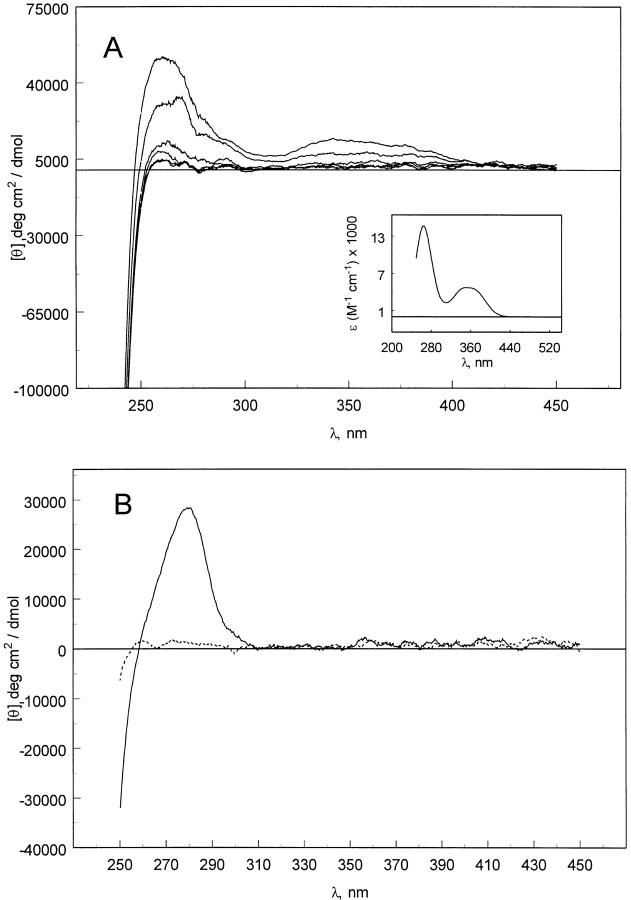
Fig. 3.
(A) Near-UV CD spectra of pelC (5 μM) with increasing concentration of ANS. PelC:ANS ratios are 1:1, 5, 10, 15, 25, and 40. The inset to A shows the absorption spectrum of ANS in water. (B) Near-UV CD spectra of pelC at pH 2 (dashed line) and pH 7 (solid line) without ANS. In both figures, the molar ellipticity is based on the protein concentration.

