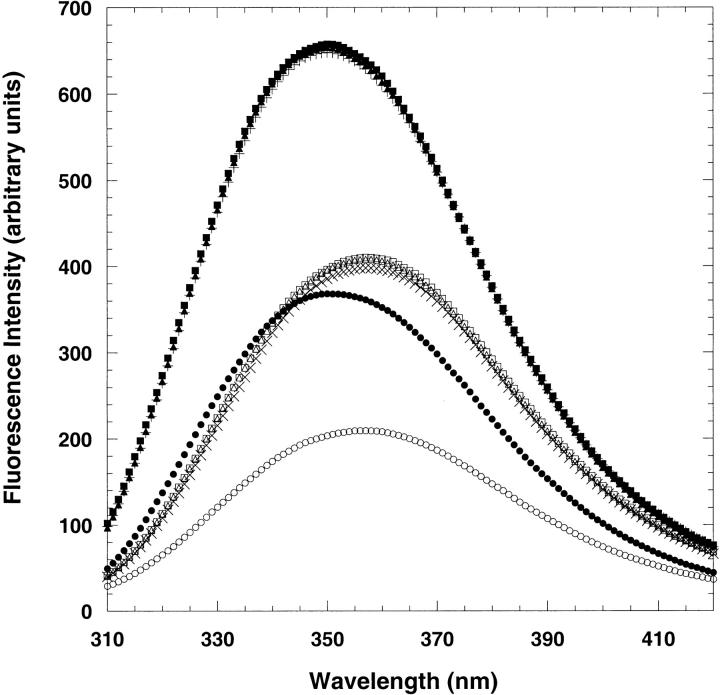
Fig. 3.
Fluorescence intensity spectra of native (0 M urea) and denatured (8 M urea) wild-type CspA (native, filled circles; denatured, open circles), Y42W (native, plus signs; denatured, times signs), S52W (native, filled squares; denatured, open squares), and T68W (native, filled triangles; denatured, open triangles). The excitation wavelength was 280 nm. The protein concentration was 3.5 μM, and the buffer contained 50 mM potassium phosphate, 100 mM KCl at pH 7.0 for all samples.

