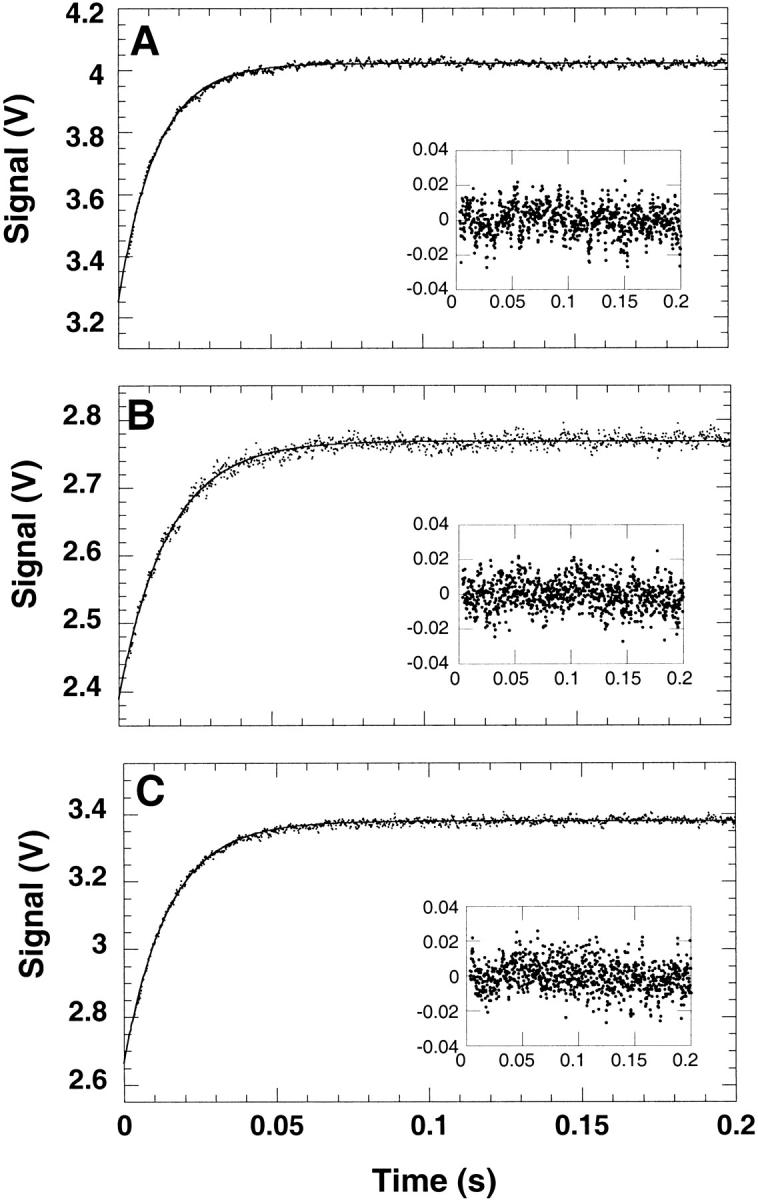
Fig. 5.

Representative refolding traces of (A) Y42W, (B) S52W, and (C) T68W. The insets show the residuals of the fit. Refolding was initiated by a 10-fold dilution of the mutants in Buffer A from 7 M urea to a final urea concentration of 2 M. The kinetics were measured by the change in fluorescence above 325 nm at a final protein concentration of 5 μM at 25°C. The observed apparent rate constants (λ) were 80 sec−1, 60 sec−1, and 66 sec−1 for Y42W, S52W, and T68W, respectively.
