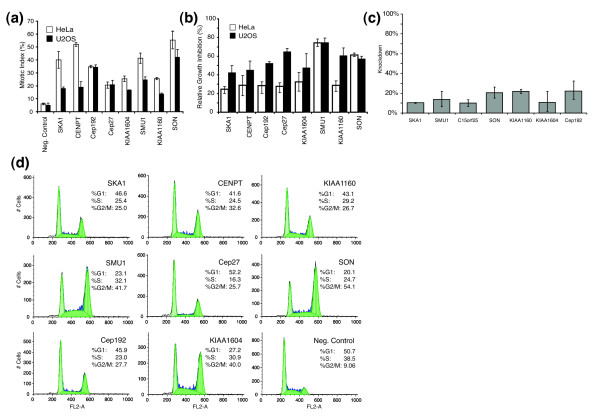
Figure 4.
Cell cycle validation of isolated genes. (a) Quantitative comparison of mitotic index values based on phospho-histone H3 (pHis) detection in HeLa and U2OS cell lines. (b) Proliferation analysis. Cell counts after 48 hours of small interfering RNA (siRNA) incubation are determined and proliferation is reported as the ratio of cell counts compared with those from the negative control. (c) mRNA knockdown levels were determined using quantitative polymerase chain reaction and are reported as a percentage of target mRNA when cells are transfected with a negative control siRNA. (d) Cell cycle analysis of HeLa cells treated with siRNAs to determine relative G1, S, and G2/M cells per candidate gene validation using flowcytometry.

