
Figure 1. Increased DHE oxidation in Lck-Bax38/1 transgenic mice.
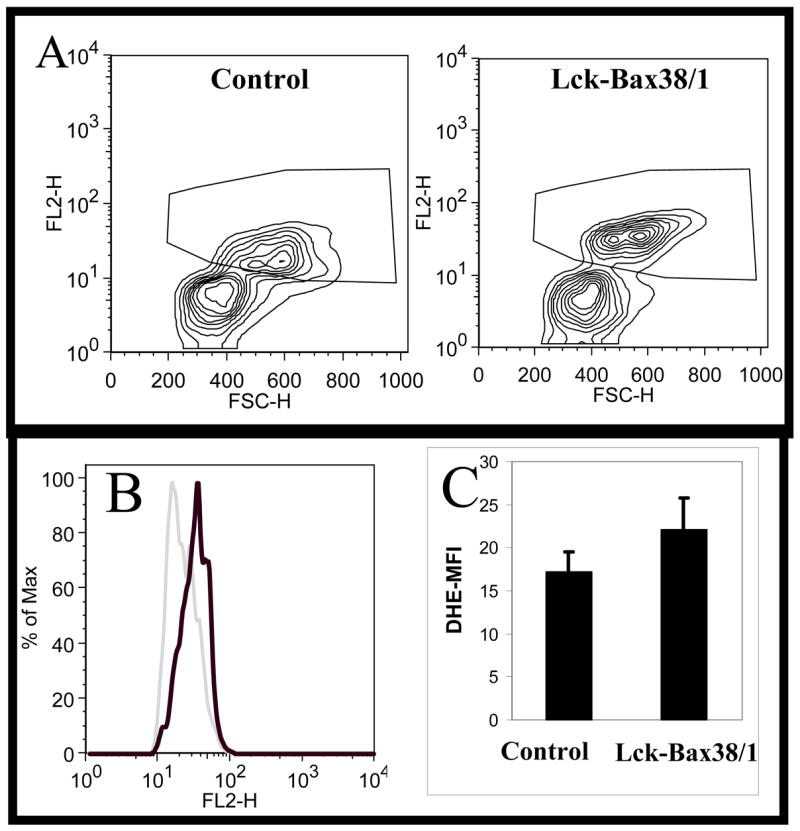
Thymocytes from control and Lck-Bax38/1 mice were isolated and stained with DHE as described in the Materials and Methods. Contour plots of viable (based on FSC-SSC staining) Thy1.2-positive lymphocytes is shown. The plots illustrate the two populations that are observed in these experiments and the gating strategy use to analyze the DHE high population. (B) Representative histogram overlay of the DHE positive population from the Lck-Bax38/1 sample (heavy dark line) and the control sample (light gray line). (C) The FL2-H mean fluorescence intensity (DHE-MFI) values (Mean +/− SEM) from four independent experiments is shown. In all four experiments, thymocytes from Lck-Bax38/1 mice had increased DHE staining relative to control mice.*P <0.01 using a two-way analysis of variance (ANOVA).