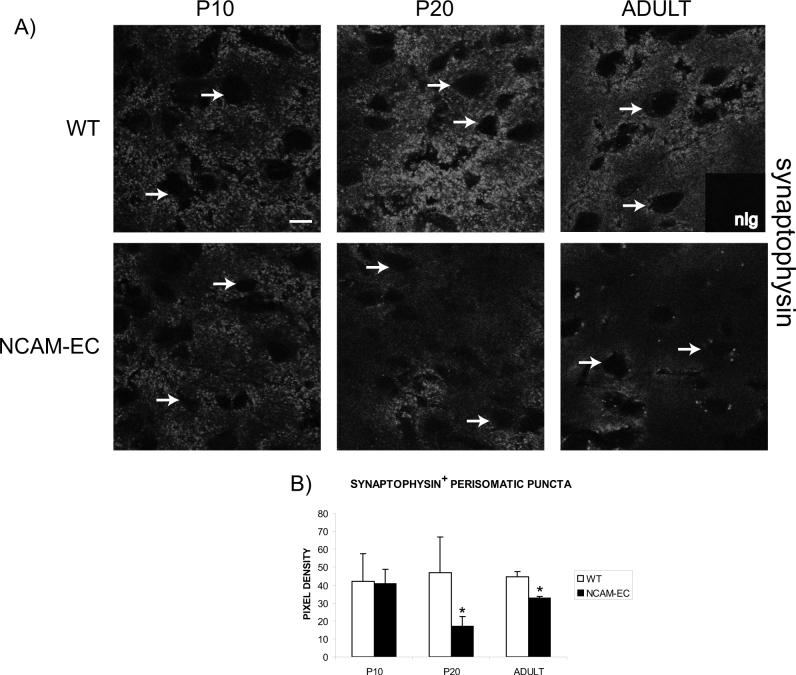
Figure 6. Excitatory synapse development is perturbed by NCAM-EC.
A) Representative images of synaptophysin immunofluorescence from layer II/III of the PFC of WT and NCAM-EC transgenic mice at P10, P20 and adult stages. Arrows indicate the location of soma. Nonimmune Ig control is included as an inset. Scale bar = 10 μm. B) Pixel density of perisomatic synaptic puncta rings. Four images were analyzed for each animal and 3 animals per genotype per stage were analyzed. Student's t test *p<0.06.

