
Figure 5. Variability in epithelial degeneration in Notch2 mutants.
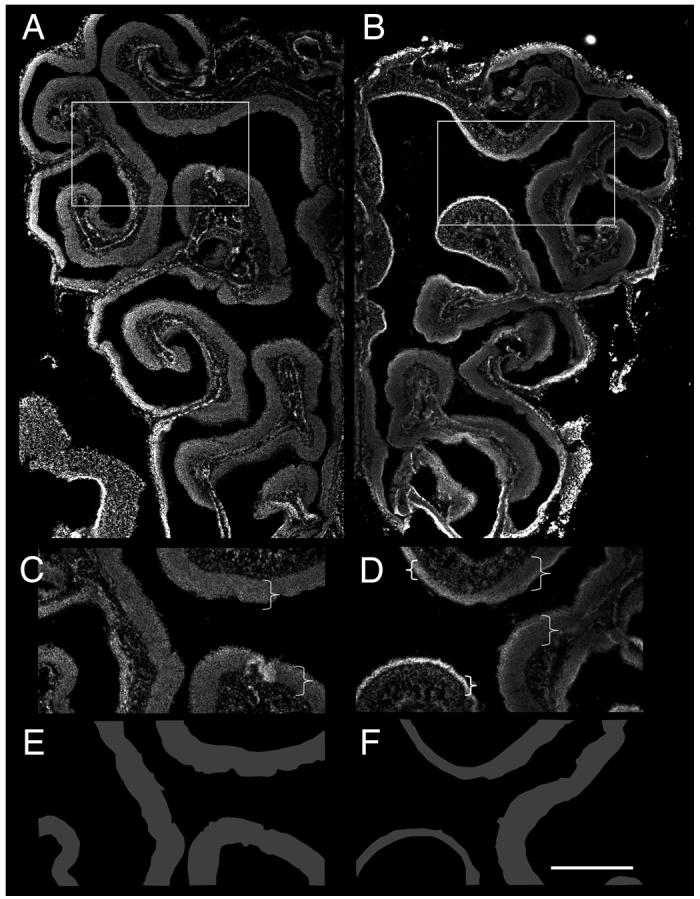
A-B) Low power images of DAPI stained coronal sections from control (A) and mutant (B) epithelium. Boxed areas are represented in (C) and (D). Brackets highlight regions of epithelia (C,D). E,F) Tracing of epithelia of in (C) and (D) to illustrate variability in mutant epithelium as compared with control. Scale bar=500μm for A-B, 300μm for C-D.