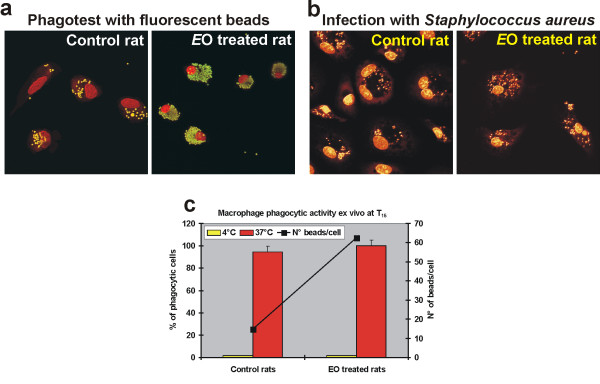
Figure 7.
Ex vivo evaluation of the phagocytic activity of MDMs obtained from EO treated and untreated rats. Confocal microscopy images showing the uptake of fluorescent beads (a) or of S. aureus bacteria (b) by MDMs obtained from EO treated and untreated rats at T15; (b) S. aureus bacteria were visible in cell cytoplasm after PI staining; original magnification: 100×. (c) Evaluation of phagocytic activity of rat MDMs performed ex vivo counting the number of phagocytic MDMs, reported as percent of phagocytic cells (solid bars), as well as the number of beads per cells (■). The percentage of phagocytic cells in controls maintained at 0°C, to block beads internalization, is also reported (yellow solid bars).

