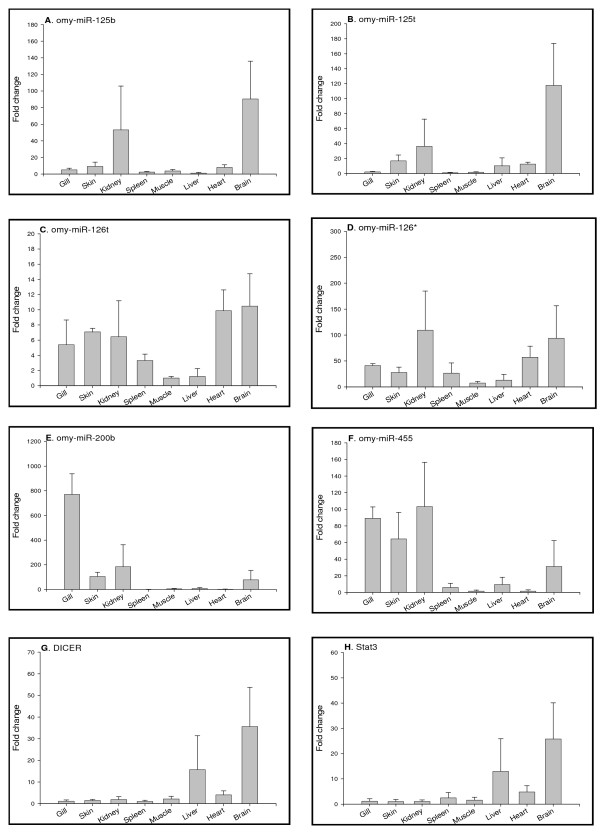
Figure 5.
Tissue distributions of miRNAs (A to F), Dicer (G) and Stat3 (H) transcripts analyzed by real-time PCR. Quantity of each miRNA or mRNA was normalized to Histone H2A. The means of the normalized gene expression values for each tissue were calculated and expressed as relative fold changes (n = 3, mean ± SEM).

