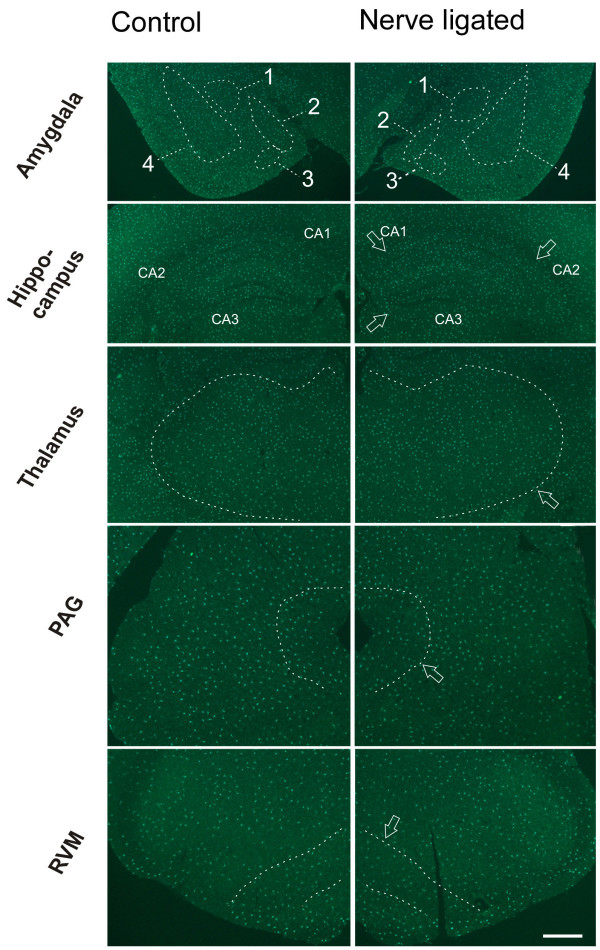
Figure 5.
Microglia in amygdala, hippocampus, thalamus, PAG and RVM of control mice. Left column, sham-operated; right column, CPN ligated. The structures are indicated by arrow or enclosed by dashed lines. 1, Central amygdaloid nucleus; 2, medial amygdaloid nucleus; 3, Posteromedial amydaloid nucleus; 4, Lateral amygdaloid nucleus, basolateral and basomedial amygdaloid nuclei. Bar = 800 μm.

