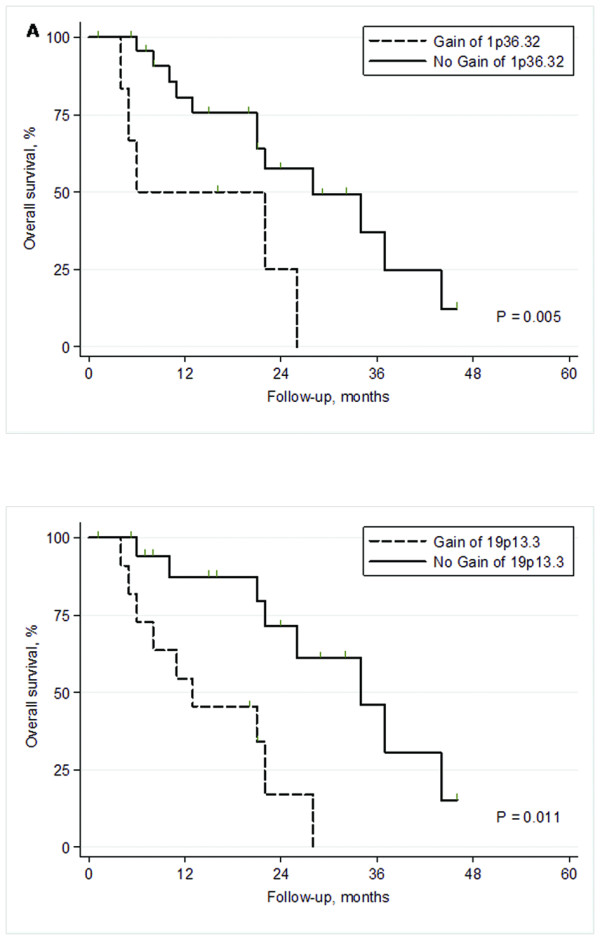
Figure 2.

Kaplan-Meier survival plots of the two prognostic regions in multivariate analysis. A) Highly significant difference in survival between patients without gain and with gain of 1p36.32 (P = 0.005). B) Difference in survival between patients without gain and with gain of 19p13.3 (P = 0.01).
