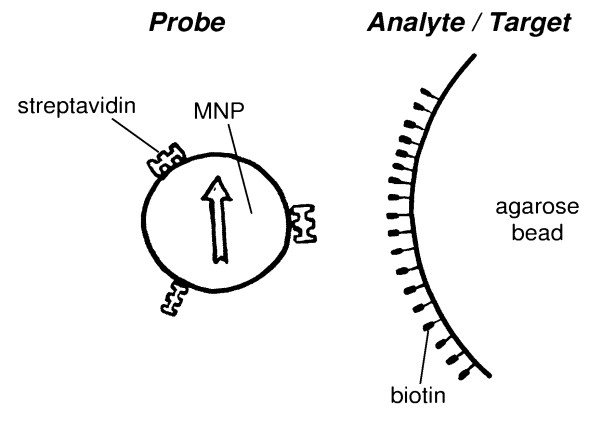
Figure 1.

Relaxation curves of the MNP*SAV measured 15 min, 1 h, 5 h and 24 h after mixing with biotin-agarose. The relaxation curves of the control samples (see text) are also depicted. The relaxation curve of immobilized MNP (freeze-dried) is the reference for completely bound MNP.
