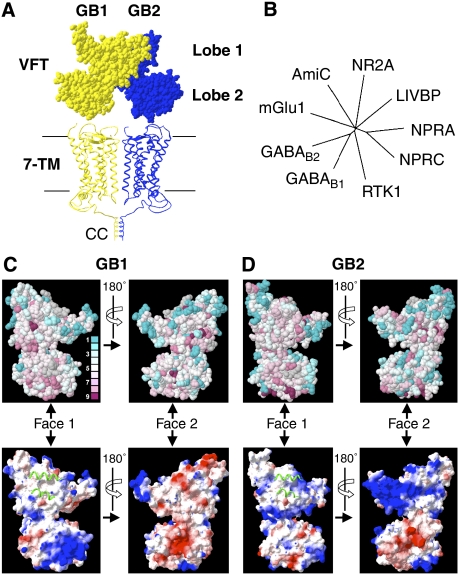
Figure 1.
Models and bioinformatic analysis of the GABAB VFTs. (A) Structural model of the dimeric GABAB receptor in the resting state. Corey–Pauling–Koltun representation of the GABAB VFT dimer model generated according to the resting state of the dimeric mGlu receptors (Protein Data Bank (PDB) accession number 1EWT), and apposition of two heptahelical domains (7TM) according to the rhodopsin dimer structure (PDB accession number 1n3m). GB1 (yellow) and GB2 (blue) are in the front and the back, respectively. The C-terminal regions of the two subunits are associated through a CC interaction that masks the RSR intracellular retention signal of GB1. (B) The phylogenetic tree was constructed using the sequences of the VFTs of the mGlu1 receptor, the amide-binding protein (AmiC) from the amidase operon, the NR2A subunit of the rat N-methyl-D-aspartate (NMDA) receptor, the leucine–isoleucine–valine-binding protein (LIVBP), the natriuretic peptide receptor types A and C (NPRA and NPRC, respectively), RTK1 from Schistosoma mansoni and the rat GB1 and GB2 subunits. Only branches with bootstrap values >600 are shown. (C, D) Evolutionary conservation of residues (upper panels) and electrostatic surfaces (lower panels) of the GB1 and GB2 VFTs visualized on both faces of the VFTs (Face 1 and Face 2). Conservation scores are indicated according to a colour scale, from variable (blue) to conserved (purple) residues. No conservation scores were calculated for the residues in grey. Electrostatic surface representations are provided (negative, red; neutral, white; positive, blue) for the VFT faces, in which the green ribbons correspond to the helices of the associated subunit in the inactive state, illustrating the possible dimerization interface.

