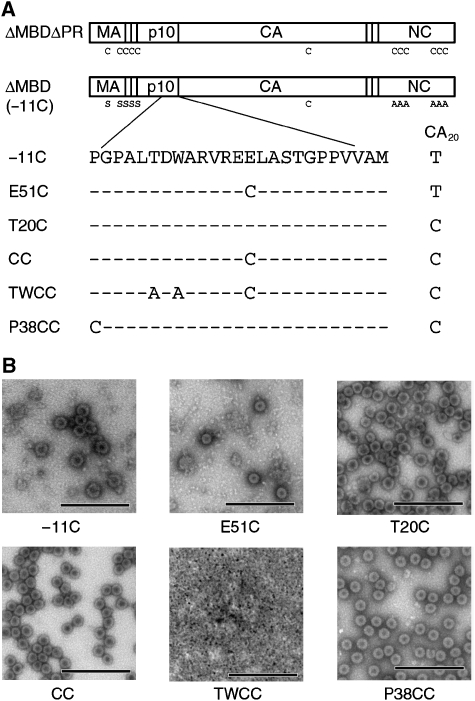
Figure 3.
(A) Schematic representation of ΔMBDΔPR showing locations of the endogenous cysteine residues and the cysteine mutations used in this study. (B) Transmission electron microscopy images of ΔMBDΔPR cysteine mutants assembled in vitro and negative stained. −11C, top left; E51C, top middle; T20C, top right; CC, bottom left; TWCC, bottom middle; P38CC, bottom right. Scale bars, 500 nm.

