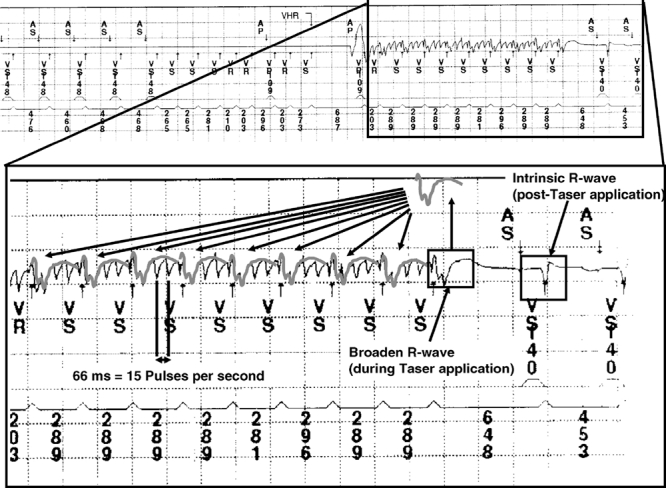
Figure 3: Magnified summed intracardiac electrograms from a patient's internal pacemaker log during stun gun discharge. Cardiac capture is shown by the high-rate ventricular sensing (cycle length 203–289 milliseconds); the cyclic, low-frequency modulation of high-frequency noise (stun gun pulses) during ventricular sensing; a single, long ventricular interval (648 milliseconds) after the energy stops; and postdischarge resumption of atrial and ventricular sensing at a rate similar to predischarge cardiac rate. The high-frequency pulses (15 pps, 66 milliseconds) are labelled on the tracing. The intracardiac electrograms from the last sensed ventricular event during stun gun application are superimposed on each prior ventricular sensed event, showing that the disruption of the high-frequency stun gun signal is consistent with modulation of the signal by a repeating R wave with morphology different than the intrinsic R wave (right side of the image). Reproduced with permission from Blackwell (Cao et al26).
