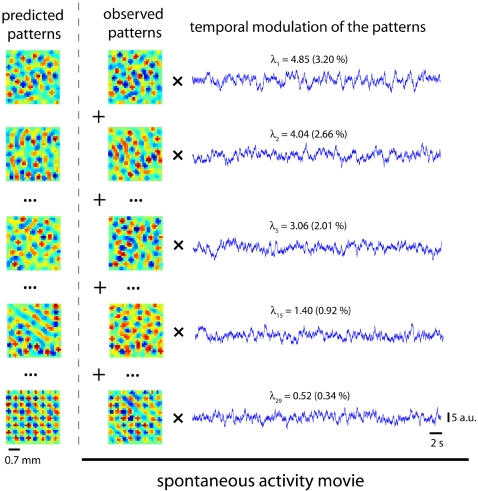
Figure 4. Decomposition of the spontaneous activity in dominant modes.
The spontaneous activity can be mathematically described as a linear superposition of spatial modes (principal components) modulated in time. On the left, we compare some predicted spatial modes with the observed ones noting a good agreement overall. The blue traces on the right represent the temporal modulation of each pattern. The eigenvalue associated with the i-th principal component, or equivalently, the mean quadratic amplitude (variance) of that mode in the spontaneous activity is given by λi. The relative variance contained in that mode is expressed as a percentage in parentheses.

