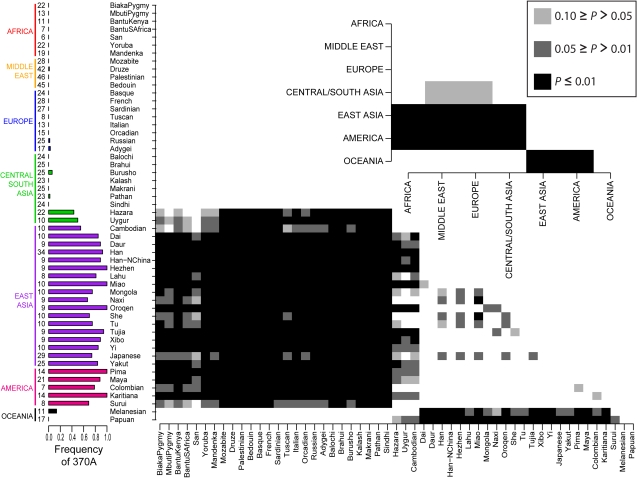
Figure 1. Worldwide allele frequencies and population differentiation for V370A.
The vertical bar chart displays the frequency of the 370A allele in each of the populations represented in the CEPH-HGDP panel with sample sizes (number of individuals) on the left. The shaded boxes in the 53×53 and 7×7 matrices show which pairwise Fst values are significant compared to the empirical distribution at three P value thresholds (see the boxed-in P value legend).

