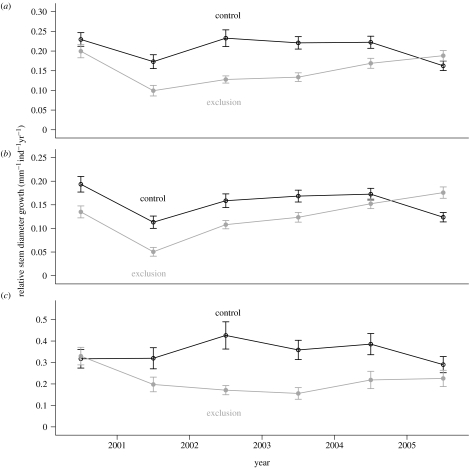
Figure 4.
Stem growth of individuals in the exclusion and control plots by different size classes: (a) >5 cm dbh (lianas) and >10 cm dbh (trees); (b) between 5 (lianas) or 10 (trees) and 20 cm dbh; and (c) >20 cm dbh. Error bars indicate ±s.e. (N is given by the number of individuals). Measurements were taken from December 1999 to December 2005. Annual stem growth was calculated as the difference in dbh measured between two sampling intervals (December of each year).

