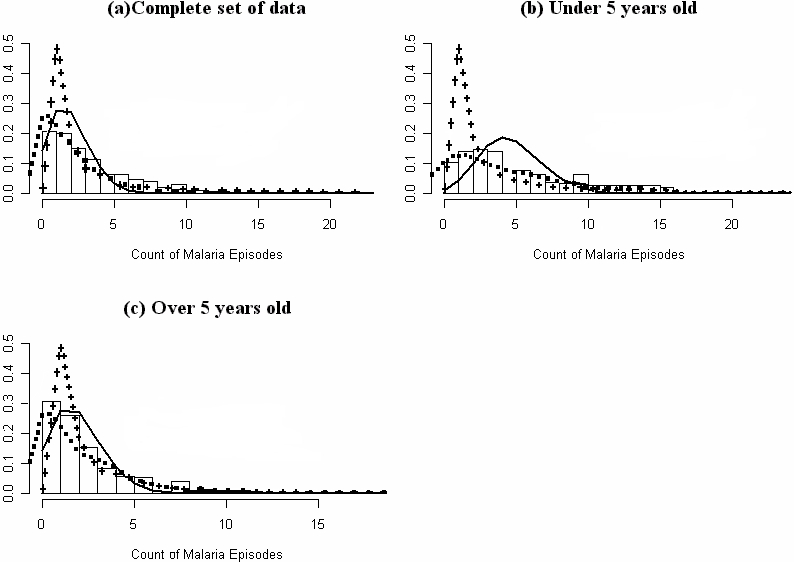
Figure 1. Comparing fit for the Poisson, Pareto and Negative Binomial distributions using observed total clinical malaria episodes per child as outcome.

The X-axis is the total clinical episodes of malaria experienced per child and Y-axis is the proportion of children with given total disease episodes. The bars are the observed total number of cases per child, the black line is the predicted totals from the Poisson regression model, the dashed line represent the predicted total episodes from the negative binomial regression model while the crossed lines represents the predicted total episodes from the Pareto distribution. Figure (a) represents all the children, (b) all children under 5 years at the time the study started (who were followed up from 1998 to 2003) and (c) children ≥5 years of age (followed up from 1998 to 2001).
