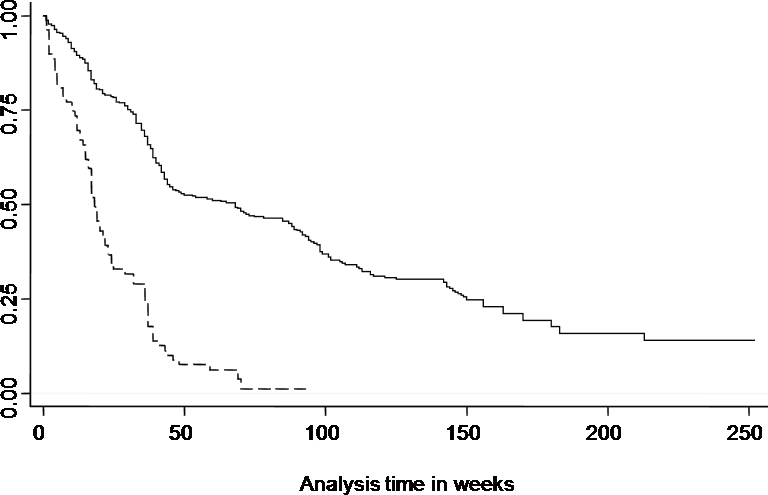
Figure 4. Kaplan-Meier survival curve of the time to first episode of clinical malaria.

Dashed line represents the ‘more susceptible’ children and the solid line represents the time to first episode for the other children.

Dashed line represents the ‘more susceptible’ children and the solid line represents the time to first episode for the other children.