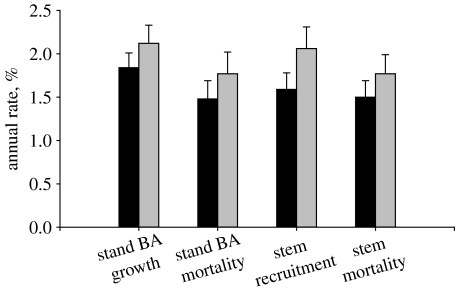
Figure 3.
Annualized stand level basal-area (BA) growth, basal-area mortality, stem recruitment and stem mortality rates from all 50 plots with two consecutive census intervals (Lewis et al. 2004b); mean with 95% CIs. All increases are significant (paired t-tests). The average mid-year of the first (black bars) and second (grey bars) intervals was 1989 and 1996, respectively.

