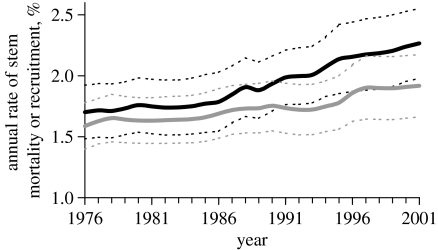
Figure 4.
Mean and 95% CIs for stem recruitment and mortality rates against calendar year, for plots across Amazonia. Black lines indicate recruitment and grey lines indicate mortality; solid lines are means and dotted lines are 95% CIs. Rates were corrected for the effects of differing census-interval lengths, for site-switching and possible ‘majestic-forest bias’ (Phillips et al. 2004). All trends hold if these corrections are not applied.

