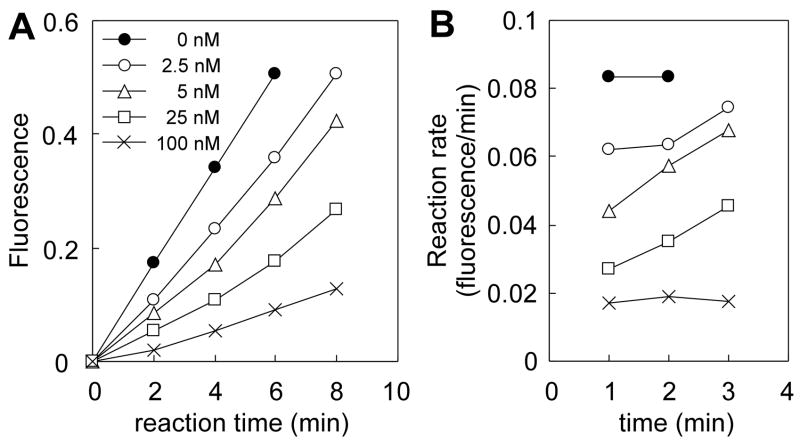
Figure 1.
Slow release of IFG from enzyme-inhibitor complex upon dilution. (A) Progress curves for the hydrolysis of substrate. GLA was preincubated with 0 to 2 μM IFG, and then rapidly diluted 20x into substrate solution to achieve the final concentrations of IFG shown. (B) Reaction rates calculated from (A).

