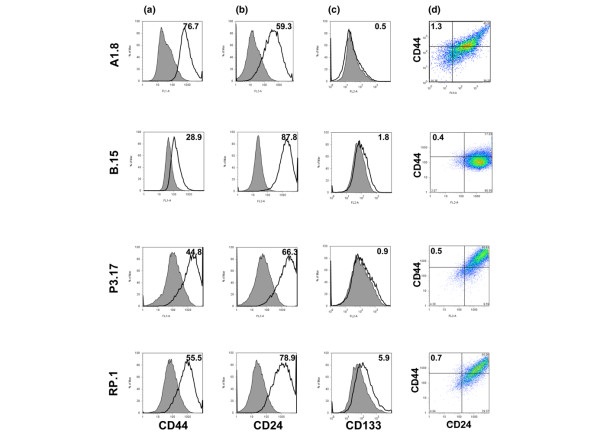
Figure 1.
Expression of putative stem cell markers from cells derived from five individual Brca1 tumors. (a) Cell surface expression of CD44 is relatively uniform across all cell lines. The open histograms, outlined by a black line, represent positive staining for CD44, and gray filled histograms show negative controls stained with matched isotype antibody. (b) Expression of CD24 is variable, with highest level in B.15 cells. (c) There was substantial expression of CD133+ cells, accounting for 5.9% of the total population, among RP.1 cells. (d) Co-expression of CD44 and CD24 markers. The quadrants are gated to separate double positive, single positive, and double negative populations. The percentage of cells with CD44+/CD24- markers is indicated at the upper left of each panel. The highest fraction is in cells derived from A1 tumor, as represented by A1.8 cells. One of more than three independent experiments is shown here.

