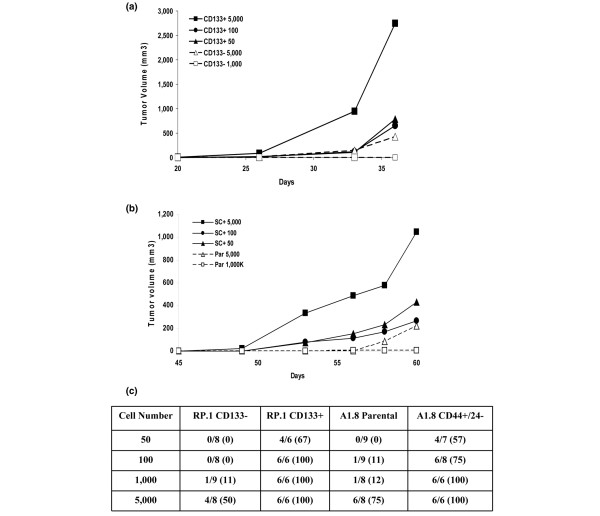
Figure 5.
Cells sorted for expression of CD44+/CD24- or CD133+ markers are enriched in tumor-initiating cells. Tumor initiating capacity was determined by implantation of 50, 100, 500 or 1,000 cells in mouse fat pad (MFP) #4 of nonobese diabetic/severe combined immunodeficient mice. (a) RP.1 CD133+ cells compared with RP.1 CD133- cells, and (b) A1.8 CD44+/CD24- cells compared with parental cells. Tumor growth rates were monitored, as described in Materials and methods, and average tumor size is shown for each cell type and cell number implanted based on triplicate implantations. (c) Total number of mice that grew tumors, as determined from independent experiments performed for each cell line. The percentages of positive tumors are indicated in parentheses.

