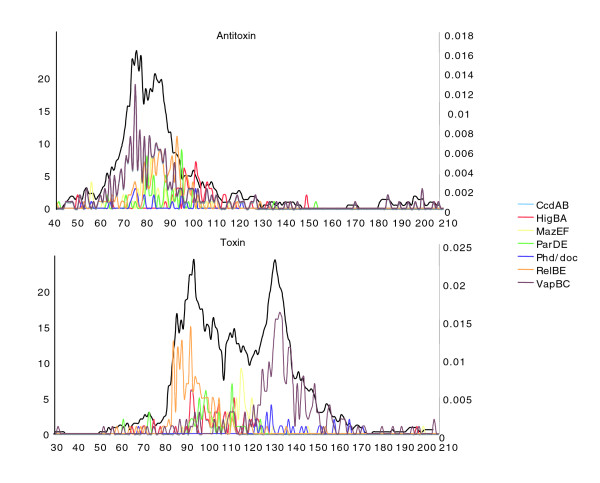
Figure 4.
Length distribution of Bacterial toxins and antitoxins. The graph represents the length distribution of antitoxins and toxins in 126 organisms (from [39]), depending on their classification (X-axis, length in amino acids; left Y-axis, number of sequences). The black curves represent the probability over the total population (1,378 TA) for a sequence of length X to constitute a TA (right Y-axis), and were used to determine the length-criterion scoring function as described in the text.

