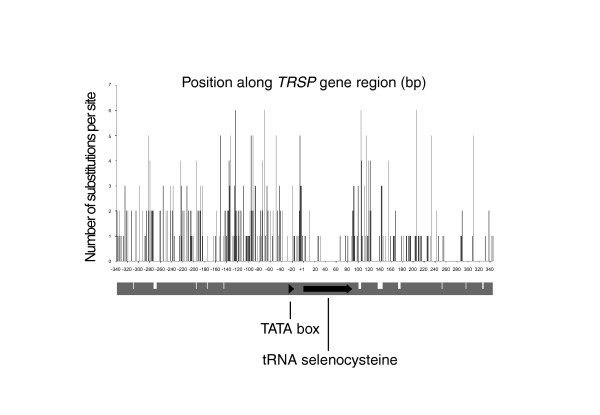
Figure 1.
Nucleotide substitutions in TRSP. Plot of the number of nucleotide substitutions per site versus position along consensus of TRSP across alignment of 11 surveyed species. The tRNA selenocysteine coding region and TATA box are labeled with black arrows. White dashes in the grey gene region represent the position and size of indels, the smallest indel being 1 bp, the largest being 8 bp.

