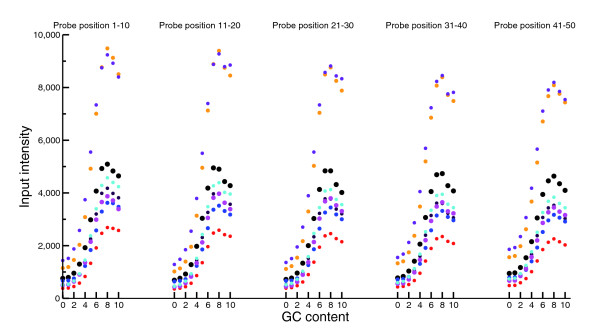
Figure 7.
Average intensities of the control channel data from [12] as a function of position-specific GC counts. Each 50-mer probe is partitioned into 5 equal parts of 10 nucleotides, and average intensities are computed as a function of GC counts in each part. Different colors represent different samples. The GC-related variations of intensities behave similarly across the five locations on probes, and we thus see that the GC effect is not position specific.

