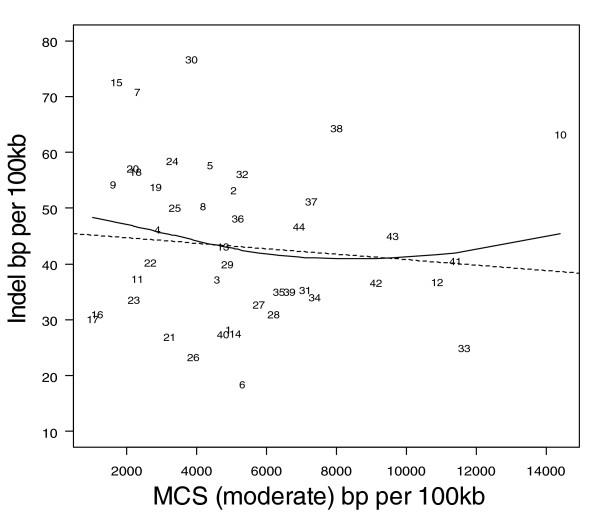
Figure 1.
Indel rate versus MCS modest for human and 13 mammals. Indel rate and multi-species constrained sequences (MCS modest) are both expressed as base pairs (bp) per 100 kilobases (kb). The solid line represents the fit from a cubic smoothing spline, whereas the dashed line is the fit from a robust linear regression.

