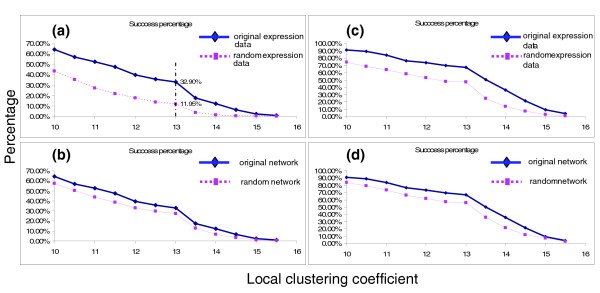
Figure 2.
A high percentage of motifs showing a significant correlation in the real data; significantly different distribution of success percentages between real and random expression data (network). (a) Significantly different distribution of success percentages at different thresholds in the two-regulator motifs between the studied real expression data and randomized (shuffled between different time points) data. (b) Significantly different distribution of success percentages at different thresholds in the two-regulator motifs between the studied real network and random networks. (c) Significantly different distribution of success percentages in the three-regulator motifs between the original expression data and the randomized data. (d) Significantly different distribution of success percentages in the three-regulator motifs between the studied real network and random networks.

