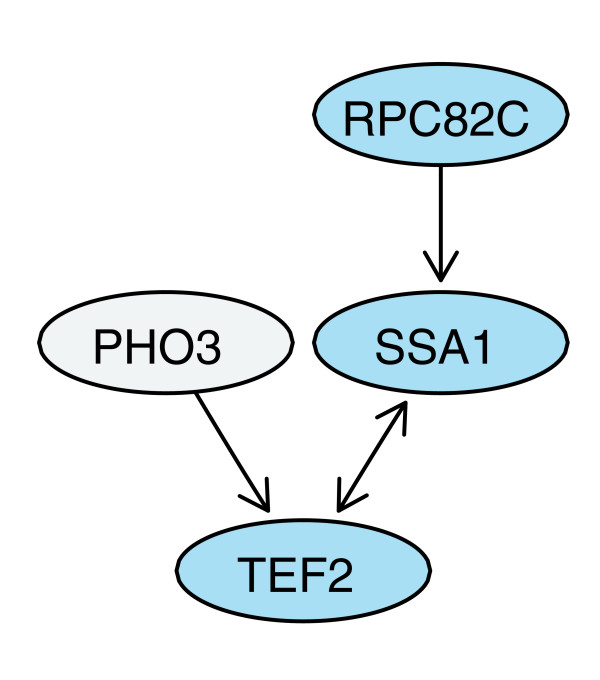
Figure 1.
Measured protein interaction data are represented by a directed graph. The graph shows the interaction data between four selected proteins from the report by Krogan and coworkers [11]. The bi-directional edge between the ATPase SSA1 and the translational elongation factor TEF2 indicates that either one as a bait pulled down the other one as a prey. The directed edge from RPC82, a subunit of RNA polymerase III, to SSA1 indicates that RPC82 as a bait pulled down SSA1, but not vice versa. Another unreciprocated edge goes from the phosphatase PHO3 to TEF2. An investigation of the dataset shows that PHO3, which localizes in the periplasmatic space, was not reported in any interaction as a prey, whereas RPC82C was. In the interpretation of the data, we would have most confidence that there is a real interaction between SSA1 and TEF2. We can differentiate between the two unreciprocated interactions; the one between RPC82C and SSA1 has been bi-directionally tested, but only found once, whereas the other one has only been uni-directionally tested and found.

