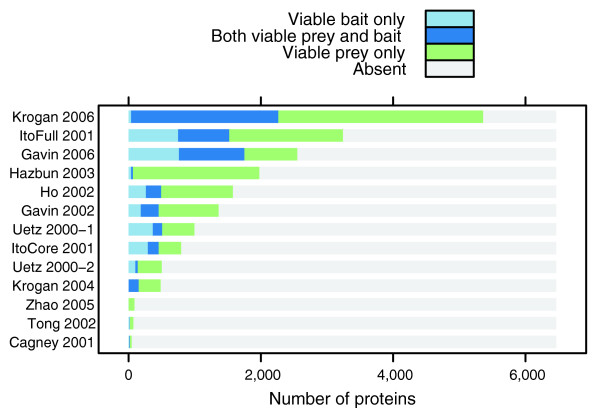
Figure 2.
Proportions of proteins sampled across datasets. This bar chart shows the proportion of proteins sampled either as a viable bait (VB), a viable prey (VP), or as both (VBP). With the exception of the data report by Krogan and coworkers [11], the other 11 datasets show large portions of the yeast genome that did not participate in any positive observations. Without additional information, there is little we can do to elucidate whether these proteins were tested but inactive for all tests, or whether these proteins were not tested.

