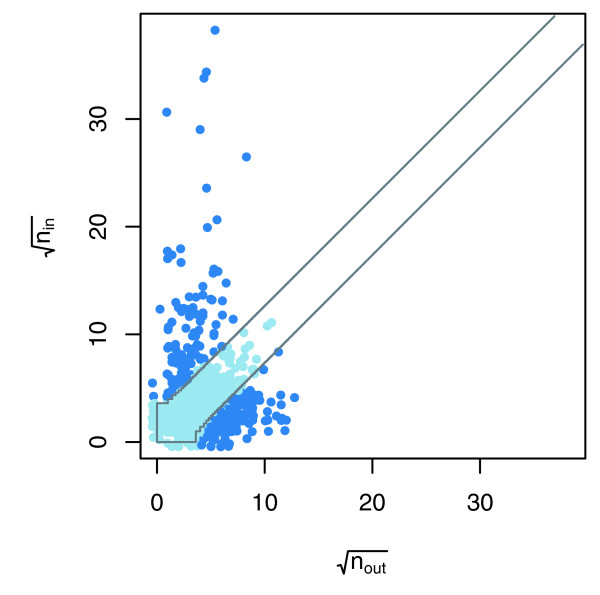
Figure 3.
Two-sided binomial test on the data from Krogan and coworkers [11]. The scatter-plot shows (op,ip) for each p ∈ VBP from the report by Krogan and coworkers [11] (axes are scaled by the square root). The proteins that fall outside of the diagonal band exhibit high asymmetry in unreciprocated degree. This figure shows a graphical representation of a two-sided binomial test. The points above and below the diagonal band are proteins for which we reject the null hypothesis that the distribution of unreciprocated edges is governed by B(np,). For the purpose of visualization, small random offsets were added to the discrete coordinates of the data points by the R function jitter. VBP, viable bait/prey.

