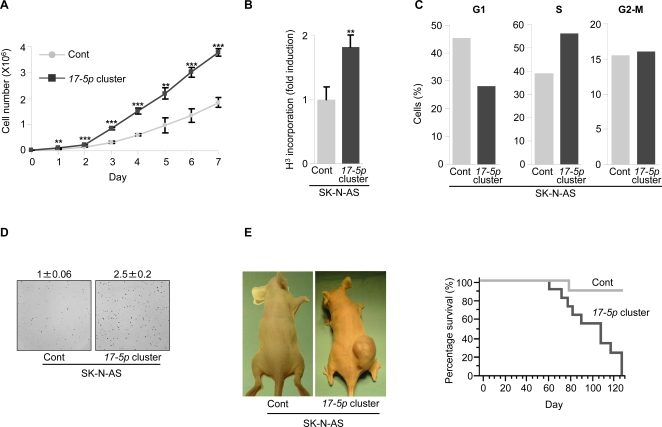
Figure 2. Overexpression of miRNA 17-5p-92 cluster augments in vitro and in vivo tumorigenesis of SK-N-AS cells.
(A) Proliferation curve of SK-N-AS stably transfected with the empty vector (Cont) or the vector expressing the miRNA 17-5p-92 cluster (17-5p cluster). Mean±s.d. (n = 3). (B) Thymidine incorporation in SK-N-AS Cont or 17-5p cluster cells. Mean±s.d. (n = 3). (C) Cell cycle analysis of SK-N-AS Cont or 17-5p cluster cells. After 30 h starvation, cells were incubated with a complete medium for 16 h before BrdU incorporation and FACS analysis. Percentage of cells in G1, S or G2-M phase of the cell cycle is indicated. A representative experiment is shown. (D) Anchorage independent growth of SK-N-AS Cont or 17-5p cluster cells. Cells were plated in a soft agar semisolid medium and colonies were counted after 2 weeks. In each experiment, cells were plated in triplicate. Representative fields are shown. Numbers indicate the fold increase of the colony number formed by SK-N-AS 17-5p cluster cells relative to SK-N-AS Cont cells (set as 1). Mean±s.d. (n = 5); P<0.001. (E) Left panel. Nude mice were injected with SK-N-AS Cont or 17-5p cluster cells and photographed four months after the injection. Representative mice are shown. Right panel. Kaplan-Meier curves showing survival of mice injected with SK-N-AS Cont (grey line) or 17-5p cluster cells (black line); P<0.05 (n = 11). ** P<0.01, *** P<0.001.

