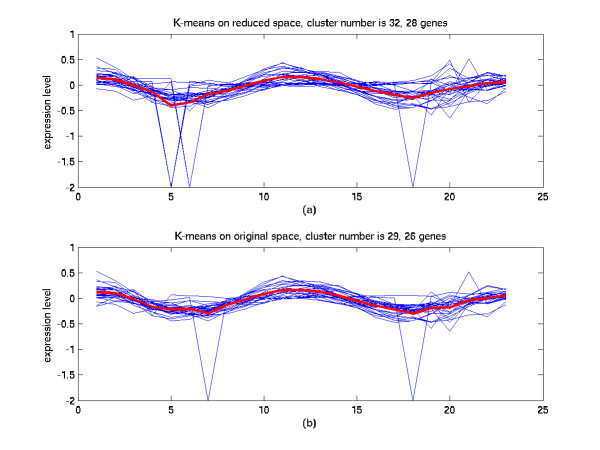
Figure 10.
Comparison of the clustering results in the reduced space and in the original space (II). (a) The 32th cluster of K-means in the 7-dimensional space from SC-MDS method. 51.8% of genes in this cluster are annotated cell cycle functions. (b) The 29th cluster of K-means in the original 23-dimensional space. 42.3% of genes in this cluster are annotated cell cycle functions.

