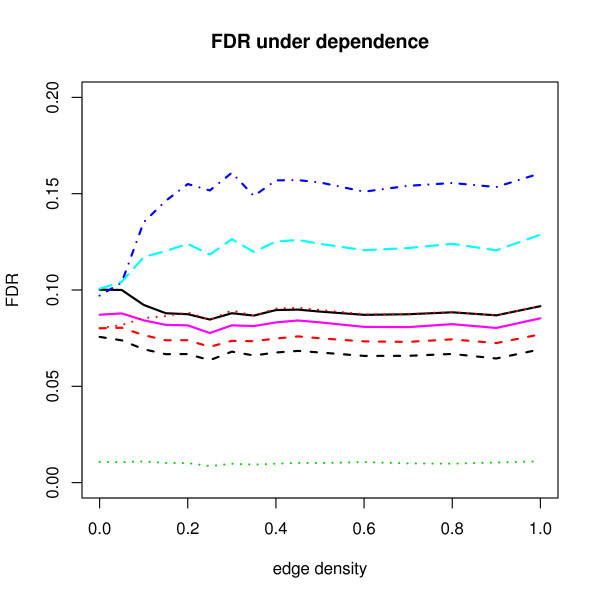
Figure 1.
Average FDR results under dependence when π0 = 0.8. The x-axis corresponds to the proportion of edges in the network and the y-axis corresponds to FDR estimates for various procedures. Testing cut-off c is tuned such that true FDR is 0.1 under independence. FDR(c) (solid black) represents true FDR values in terms of (5) using the fixed c. The FDR procedures and corresponding lines in this figure are the following ones: BH (dashed red), BY (dotted green), SAM (dot-dashed blue), Qvalue (dashed cyan), ABH (purple), the upper limit RBH (dashed black), the point RBH (dotted red).

