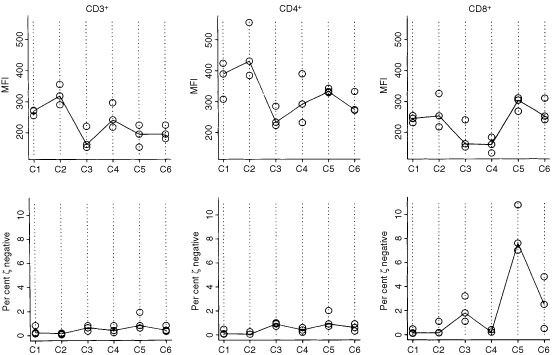
Figure 1.

Intra-individual variability of MFI for ζ-chain expression and the per cent of ζ-chain-negative cells in CD3+, CD4+ and CD8+ T cell subsets obtained from six normal donors (C1–6). The samples were drawn at three different time points 1 month apart. PBMC were cryopreserved and tested in the same assay to establish the biologic variation within each individual evaluated over a 3 month period. The solid line connects the median values. Of note, the percentages of ζ-chain-negative T cells are very low in normal controls, except for CD8+ T cells in C5.
