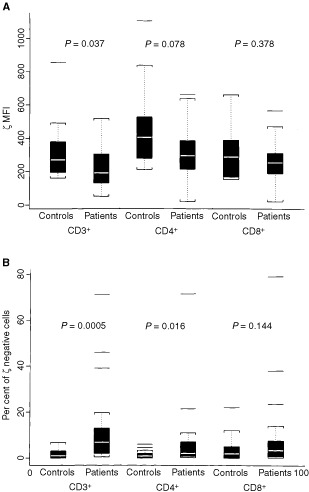
Figure 2.

Comparisons of the ζ-chain expression in T cells and T-cell subsets between patients and healthy controls are presented as box- whisker plots. The white bar represents the median; the box represents the interquartile range; the whiskers represent 1½ times the interquartile range; and the single lines show the outliers. Nineteen healthy controls were compared with 18 patients with prostate cancer. (A), MFI for ζ-chain expression and (B), percentages of ζ-chain-negative cells in patients and healthy controls are shown. The P values were calculated by the exact Wilcoxon test.
