
Figure 4.
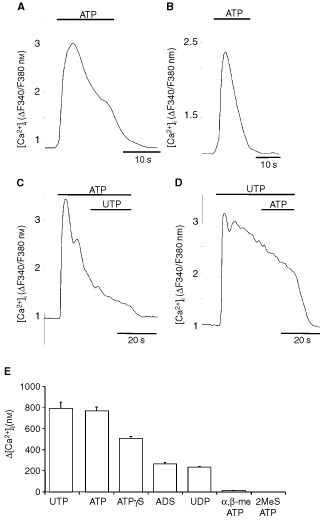
Functional expression of P2-receptors. (A) Biphasic increase of [Ca2+]i after ATP application (100 μM) in Ca2+-containing bath solution. (B) Monophasic [Ca2+]i rise after ATP application (100 μM) in Ca2+-free solution. (C) Application of UTP (100 μM) during prolonged ATP stimulation (100 μM) failed to elicit any further response. (D) Application of ATP (100 μM) during prolonged UTP stimulation (100 μM) did not cause any further rise of [Ca2+]i. The [Ca2+]i is given as the fluorescence ratio (ΔF340/F380 nm) of the Ca2+-sensitive dye fura-2. Representative single-cell tracings out of three independent experiments with 20 or more cells per incubation are shown. (E) Different nucleotides in equimolar concentration (100 μM) induced distinct increases of [Ca2+]i in KYSE-140 cells measured under [Ca2+]e-containing conditions. Values are given as the peak increase above basal [Ca2+]i of resting cells. The basal level of resting cells amounted to 58±7 nM. Means±s.e.m. of 44 to 98 cells per nucleotide are shown.