
Figure 1.
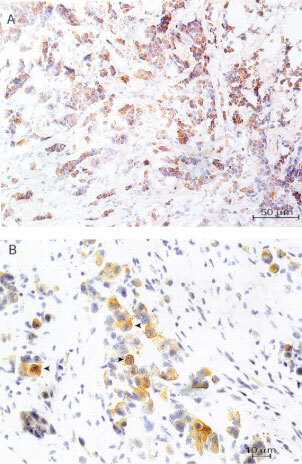
Representative immunostaining of Akt-1 (A) (200×) and pAkt (B) (400×), note the arrowheads indicating positive staining in the cytoplasm of malignant cells.
Official websites use .gov
A
.gov website belongs to an official
government organization in the United States.
Secure .gov websites use HTTPS
A lock (
) or https:// means you've safely
connected to the .gov website. Share sensitive
information only on official, secure websites.
Representative immunostaining of Akt-1 (A) (200×) and pAkt (B) (400×), note the arrowheads indicating positive staining in the cytoplasm of malignant cells.