
Figure 1.
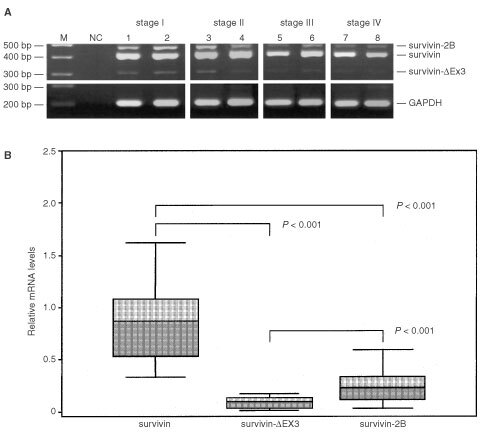
RT–PCR amplification (A) and relative (GAPDH-normalised) mRNA levels (B) of survivin and its alternative splice variants in gastric cancer. (A) Two μg of total RNA was reversely transcribed and amplified by polymerase chain reaction. PCR-products were electrophoresed and visualised by ethidium bromide staining. Four arbitrarily selected examples of each UICC disease stage are shown. M, molecular weight marker; NC, negative control (H2O); survivin (431 bp); survivin-2B (500 bp); survivin-ΔEx3 (329 bp). (B) Survivin is the dominant transcript. P-values were calculated by the Wilcoxon-test.