
Figure 3.
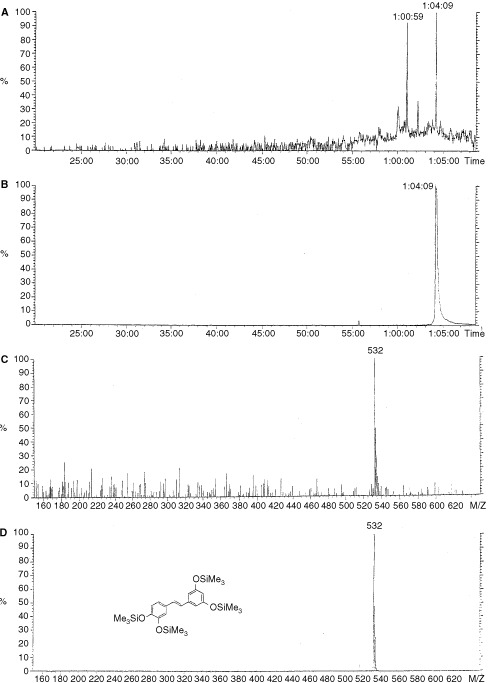
GC–MS studies on the derivatised metabolism sample. (A) Shows the GC–MS elution profile of the derivatised metabolism sample, displayed as a single ion chromatogram at m/z=532. (B) Shows the GC–MS elution profile, displayed as a single ion chromatogram at m/z-532, for derivatised authentic piceatannol (Pic-TMS; m/z=532). (C) Shows the mass spectrum of the metabolism sample peak that eluted at 64 min and 9 s. (D) Shows the mass spectrum of derivatised authentic piceatannol (Pic-TMS).